Grafana on AWS EC2 Setup Tutorial

What is Grafana, and why is it used for monitoring?
- Grafana is an 📈
open-sourceanalytics and monitoring platform that allows users tovisualize,query, andanalyze datafrom various data sources. It's commonly used for monitoring because it provides a user-friendly interface for creatinginteractive dashboardsandalerts, making it easier to track the performance of systems and applications.
What are the features of Grafana?
🚀 Data Visualization: Grafana empowers users to design visually engaging and interactive dashboards, enabling the representation of data through charts, graphs, and other visual elements.
🔌 Data Source Integration: The flexibility of Grafana allows it to connect seamlessly with a wide array of data sources, including databases, cloud services, monitoring systems, and more. This capability enables the consolidation of data from multiple sources into a single dashboard.
📈 Time Series Data: Grafana excels at handling time series data, making it an ideal choice for monitoring and analyzing data that evolves over time, such as system metrics, performance data, and IoT-related information.
🚨 Alerting: Within Grafana, users can establish alerting rules, ensuring that they receive notifications when specific conditions are met. This feature is pivotal for proactive monitoring and the timely resolution of issues.
🧩 Plugin Architecture: Grafana's extensible plugin system offers numerous options for enhancing functionality, with a wide selection of plugins available for data sources, visualization types, and custom integrations.
📆 Data Exploration: Grafana simplifies the exploration of historical data, permitting users to focus on specific time ranges and conduct thorough data analysis, facilitating the identification of trends, anomalies, and historical context.
📧 Notification Channels: Grafana supports multiple notification channels, such as email and Slack, enabling users to configure channels for receiving alerts and updates from their dashboards.
🧑🤝🧑 Collaboration: The platform accommodates multiple users who can collaborate on dashboards and share them with team members. Access permissions can be set to control viewing and editing rights.
🧹 Data Transformation: Grafana offers the capability to manipulate and transform data before presentation on dashboards, aiding in data cleaning and ensuring meaningful data display.
🌐 Integration: Grafana seamlessly integrates with various other monitoring tools and services, including Prometheus, InfluxDB, Elasticsearch, and more, positioning itself as a central component within a comprehensive monitoring and observability stack.
📚 Documentation and Community: Grafana boasts an extensive repository of documentation and an active community, providing access to support, plugins, and resources for maximizing the potential of the platform.
📊 Customization: Grafana is highly customizable, allowing users to craft dashboards tailored to their specific requirements and branding.
Why Grafana?
Grafana is the top choice for monitoring and data visualization, and here's why: it's
open-sourceand packed with powerful features.It seamlessly connects to different data sources and provides user-friendly dashboards for making data easy to understand.
Grafana is particularly great with data that changes over time, making it ideal for tracking evolving metrics.
It also has strong alerting capabilities to
catch issuesearly and a robust plugin system that lets you customize and integrate with various tools.With Grafana, exploring historical data is a breeze, allowing for
deep analysis. It's a versatile tool that encourages teamwork and can be tailored to your specific needs, making it perfect for teams and organizations looking for effective monitoring and observability solutions.
1. Setup Grafana in your AWS EC2 Instance
- Go to the AWS console and Launch an EC2 instance for Grafana.
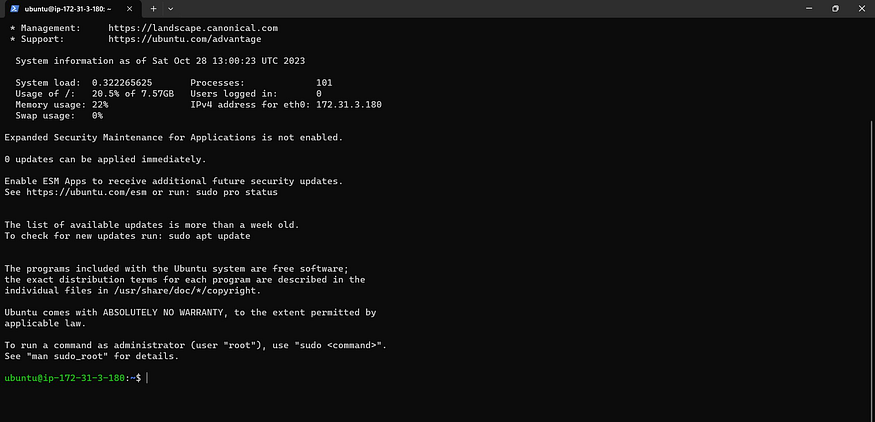
- Once the instance is launched, you can SSH into the instance.
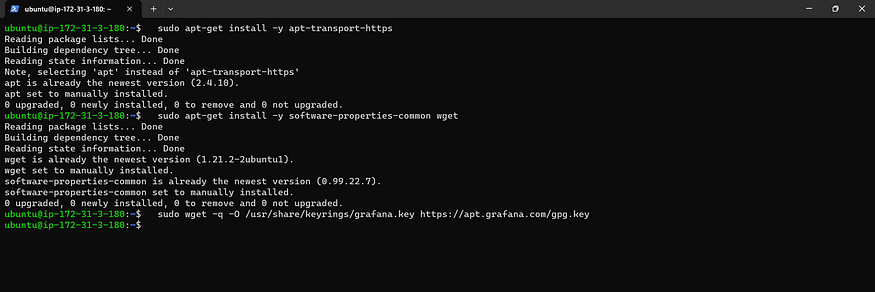
- To install the required packages and download the Grafana repository signing key, run the following commands: Know More about Grafana Installation
  sudo apt-get install -y apt-transport-https
  sudo apt-get install -y software-properties-common wget

  # Getting the key
  sudo wget -q -O /usr/share/keyrings/grafana.key https://apt.grafana.com/gpg.key
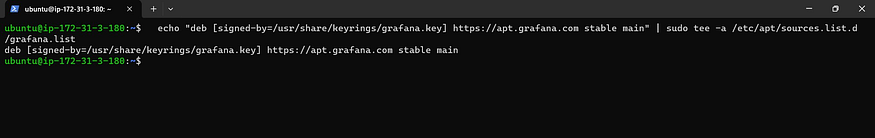
- To add a repository for stable releases, run the following command:
echo "deb [signed-by=/usr/share/keyrings/grafana.key] https://apt.grafana.com s
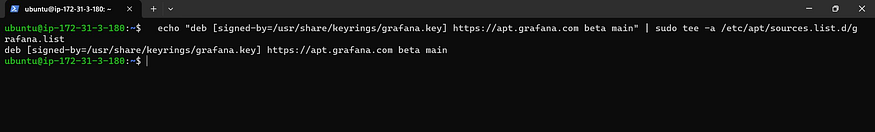
- To add a repository for beta releases, run the following command:
echo "deb [signed-by=/usr/share/keyrings/grafana.key] https://apt.grafana.com b
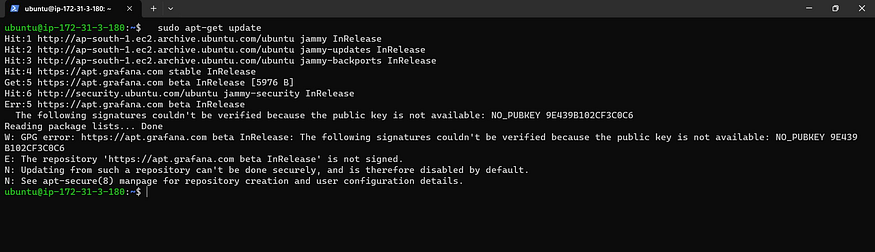
- Run the following command to update the list of available packages:
sudo apt-get update
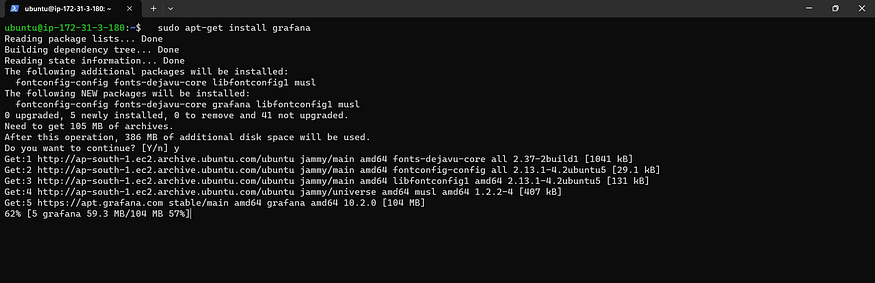
- To install Grafana OSS, run the following command:
sudo apt-get install grafana
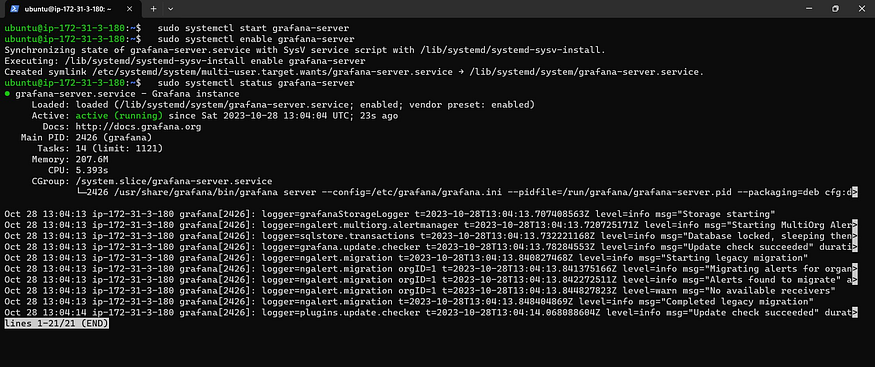
- Start and Enable the grafana-server
  #Start Grafana-Server
  sudo systemctl start grafana-server

  #Enable the Grafana-Server
  sudo systemctl enable grafana-server

  #Check the status of grafana
  sudo systemctl status grafana-server
- Open port 3000 in your EC2 instance’s security group to allow external access to Grafana.
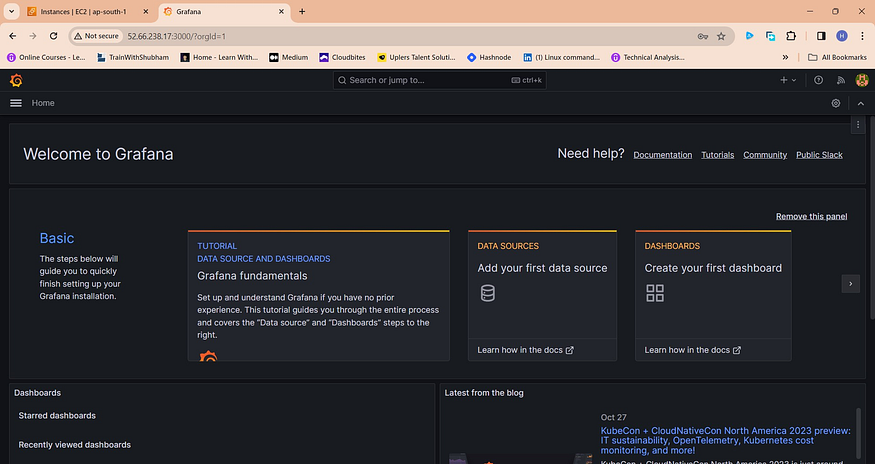
- Once the port is enabled you can access the Grafana Dashboard by using a public IPv4 address followed by Grafana port 3000.
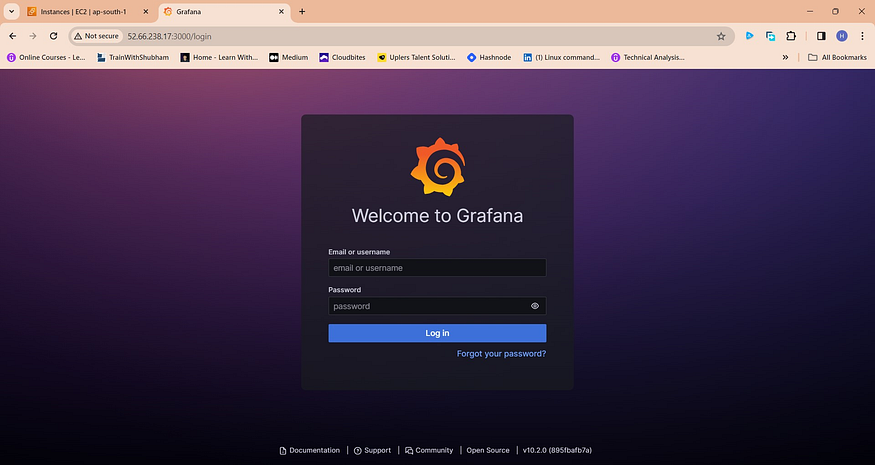
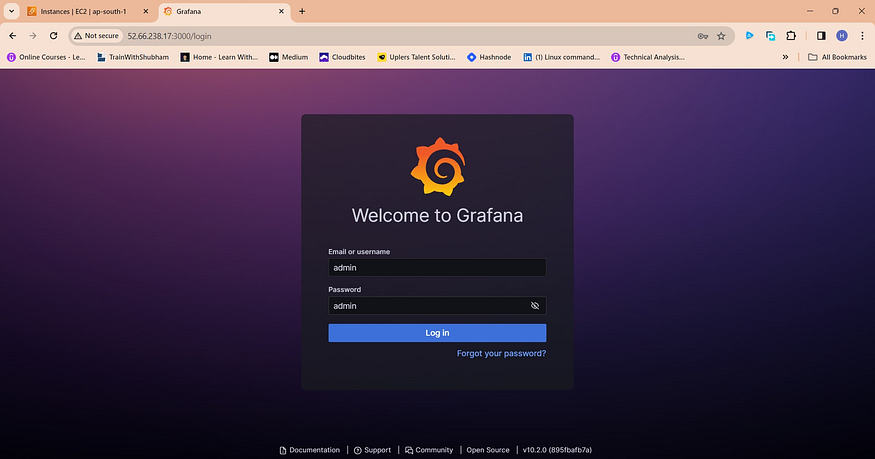
- By default, Grafana credentials are username=admin and password=admin. Using this password change prompt will come.
- Change the password, you will be logged into Grafana Dashboard
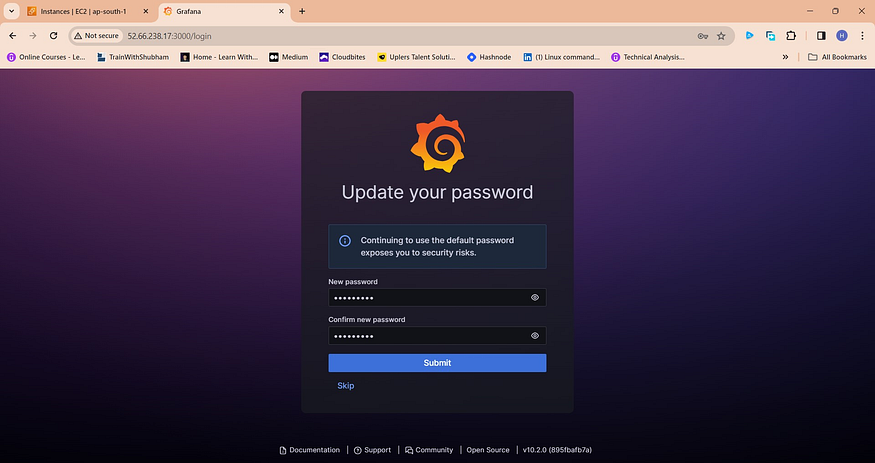
- As the password has been changed you are now Logged In to Grafan HomePage.