Sending Docker Logs to Grafana
Published
•3 min read
Install Loki & Promtail using Docker
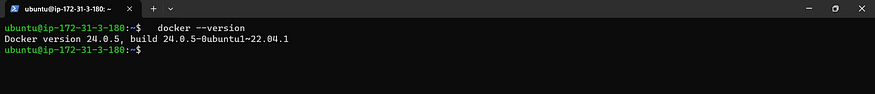
Before installing Loki & Promtail make sure you have docker installed in your instance.
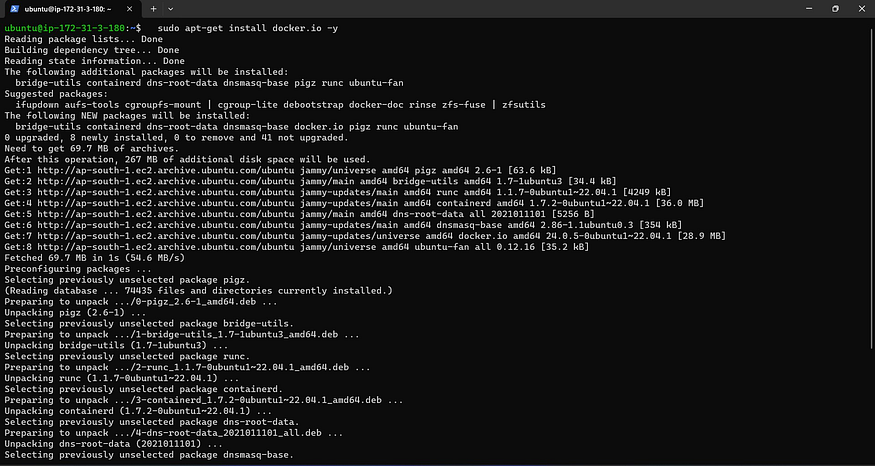
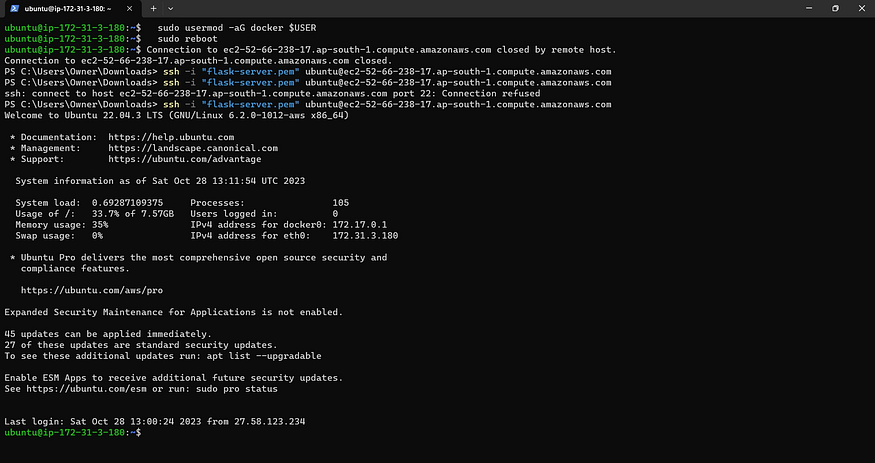
    sudo apt-get update
    sudo apt-get install docker.io -y

    # Giving docker permission to current user
    sudo usermod -aG docker $USER
    sudo reboot

    # Verify Docker version
    docker --version
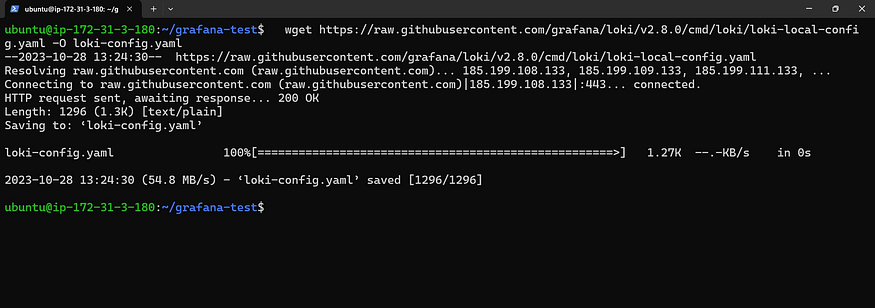
- Download the Loki Config file into your current directory.
wget https://raw.githubusercontent.com/grafana/loki/v2.8.0/cmd/loki/loki-local-config.yaml -O loki-config.yaml
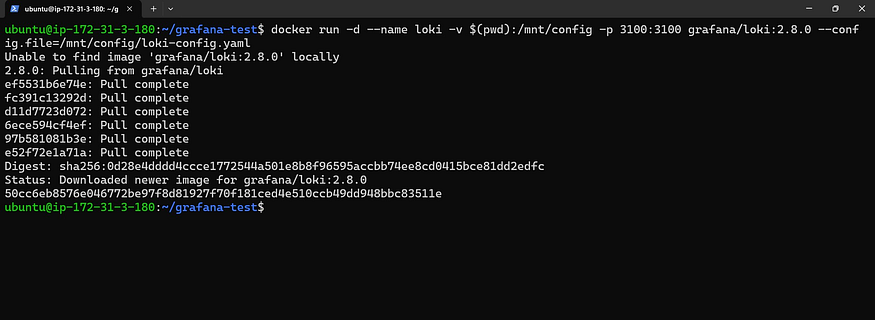
- Run the Loki container using the following Docker command.
docker run -d --name loki -v $(pwd):/mnt/config -p 3100:3100 grafana/loki:2.8.0 -
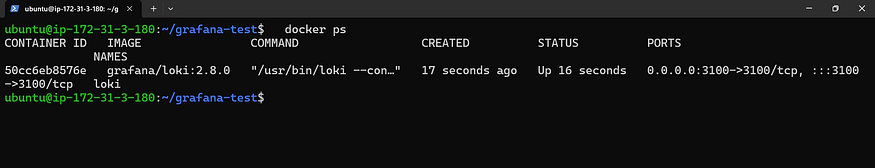
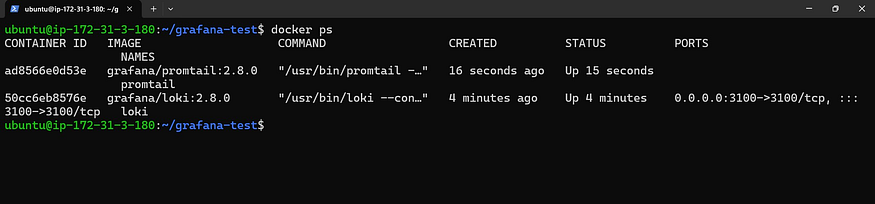
- We can verify Loki is running using the docker container by using the following Docker command :
docker ps
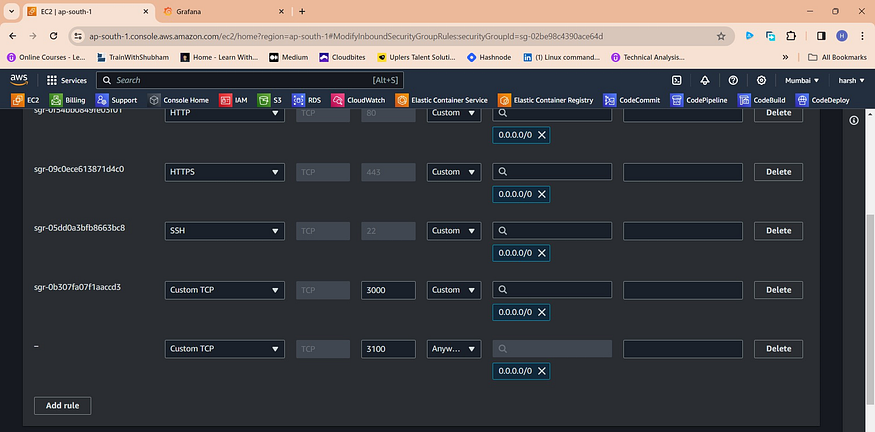
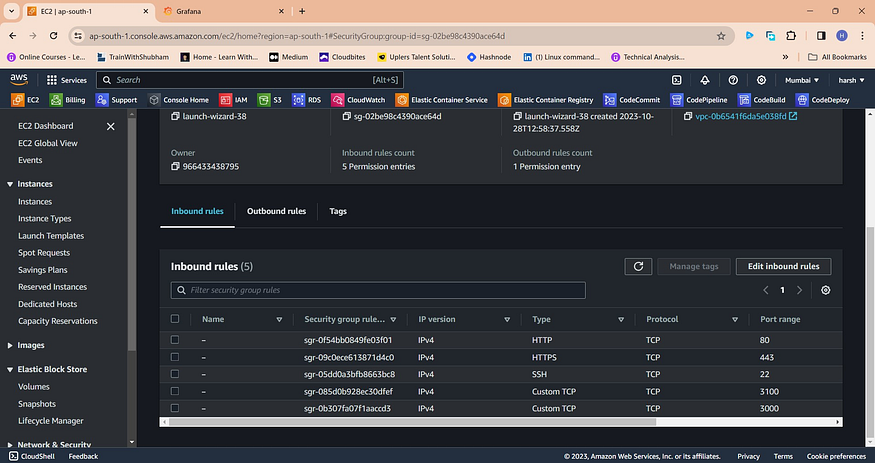
- Now to access Loki, Go to the Security Group of your EC2 instance and add port 3100.
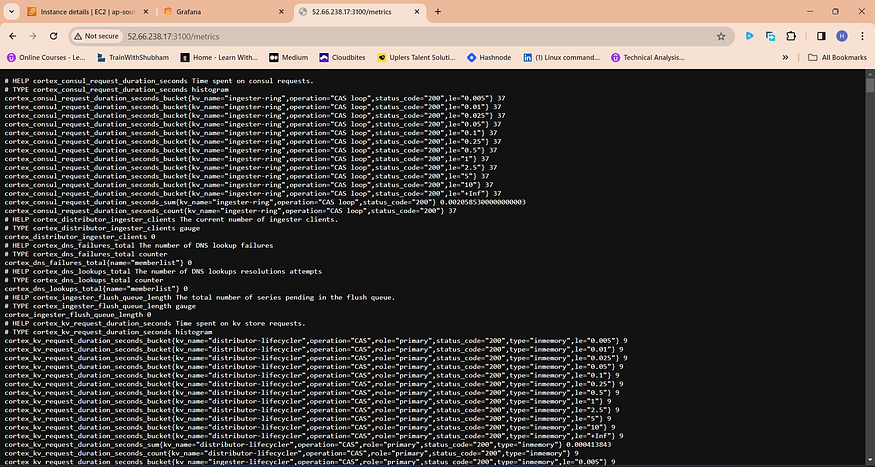
- We can see Loki’s metrics using the IPv4 address followed by port 3100 and metrics.
http://<public_ipV4>:3100/metrics
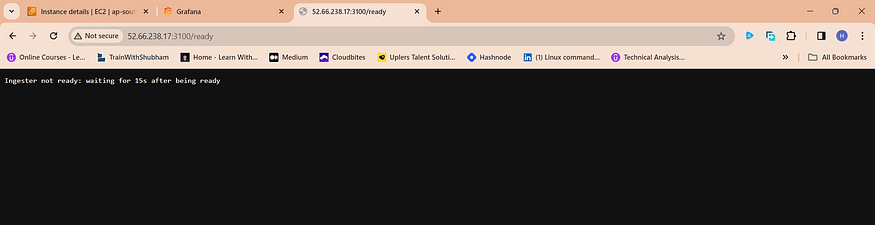
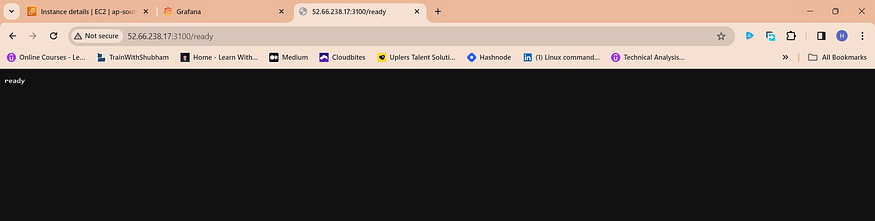
- To verify whether Loki is ready or not, access the IPv4 address followed by port 3100 and ready.
http://public_ipV4:3100/ready
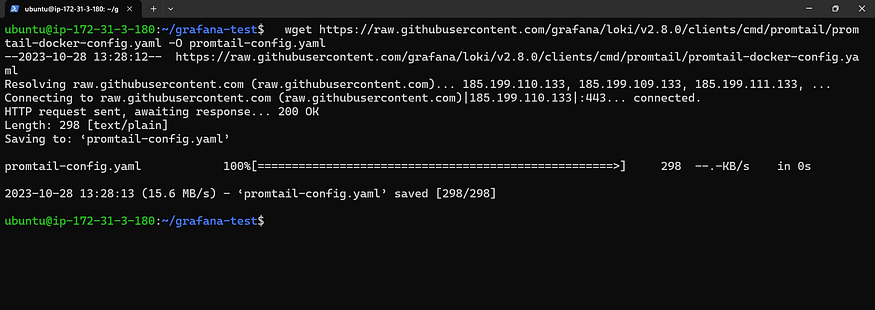
- Now download the Promtail Config yaml file into your directory by using the following command:
wget https://raw.githubusercontent.com/grafana/loki/v2.8.0/clients/cmd/promtail/pr
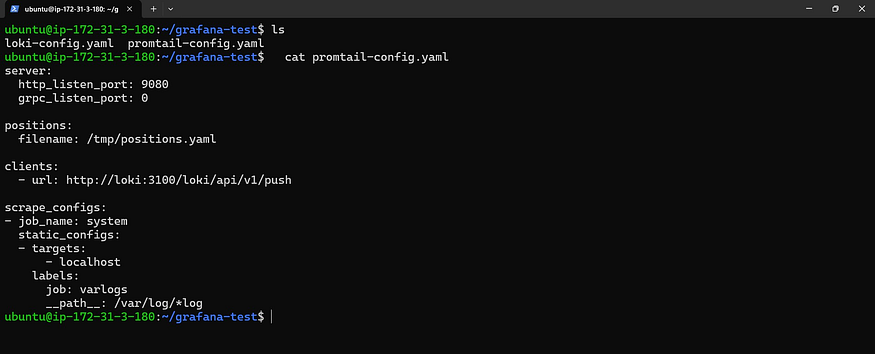
- We can verify Promtail configuration file is there in the directory by using the following command:
  ls

  cat promtail-config.yaml
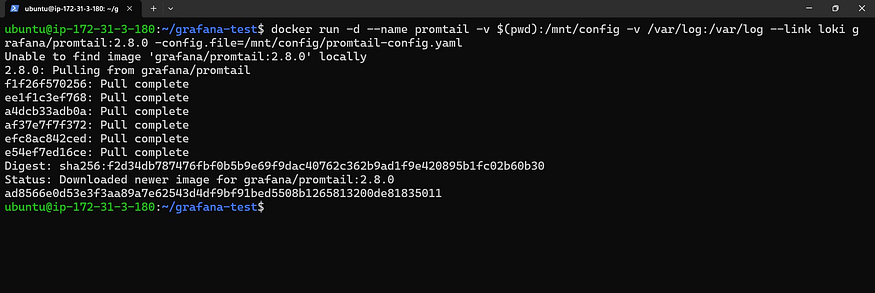
- Now execute the Promtail container by using the following Docker command:
docker run -d --name promtail -v $(pwd):/mnt/config -v /var/log:/var/log --link
- We can verify both Loki and Promtail are running using
docker pscommand.
Configure Loki as a Data Source
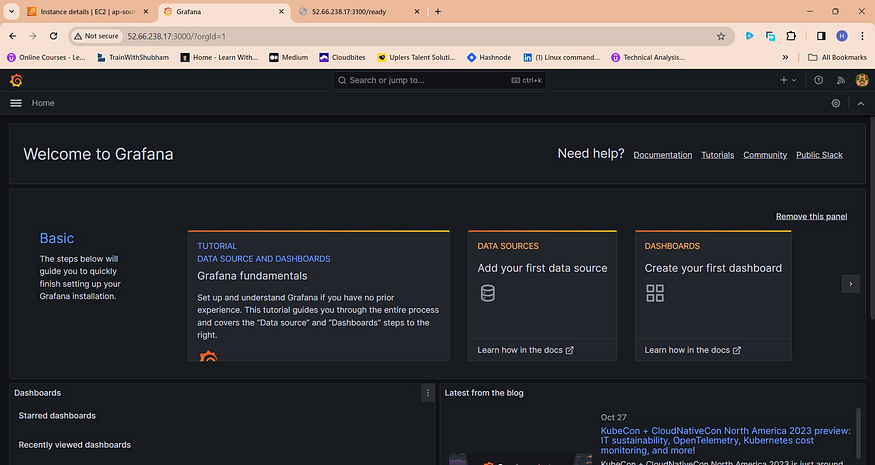
- Once both Loki and Promtail are configured in the instance, Login to the Grafana Home Page
- In the navigation drawer either there is DataSource click on it or you can get it by clicking on the left hamburger menu, hovering over there is a gear icon (second last one) and clicking on “Data Sources”.
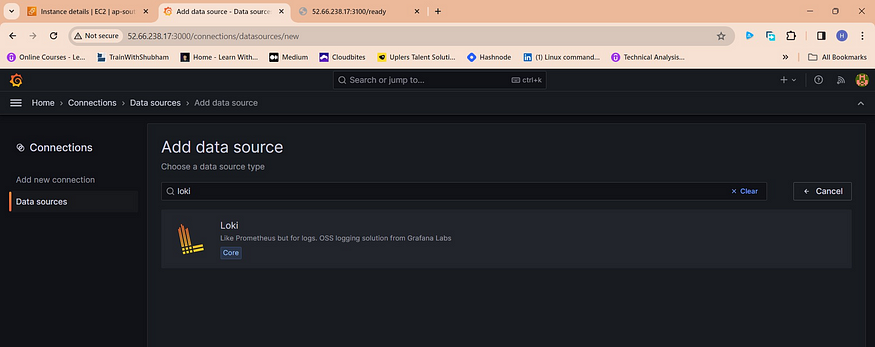
- Click on “Add data source” and search for “Loki”. Click on it.
- As the Loki prompt is opened fill in the details like Name and in the HTTP provide the URL i.e, http://127.0.0.1:3100
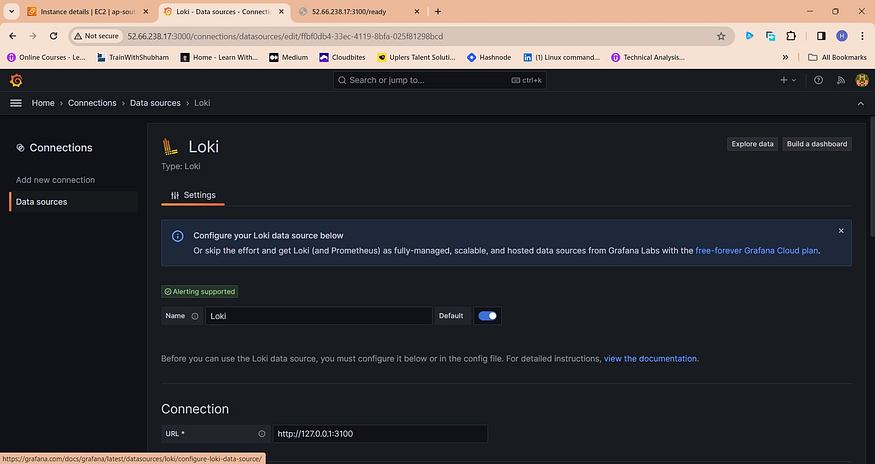
Click on “Save and Test”. You will get a prompt saying “Data Source Successfully Connted” so you can conclude that your connection to Grafana using Loki and Promtail is successful.
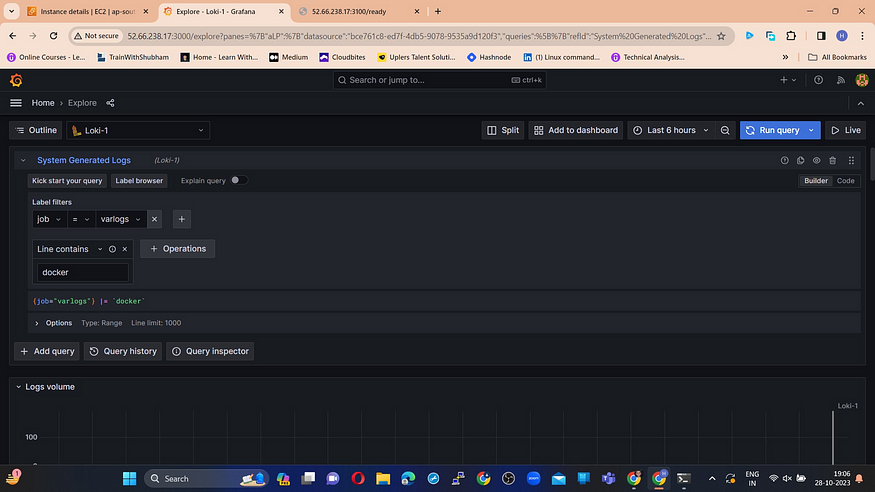
Now click on Explore to create metrics.
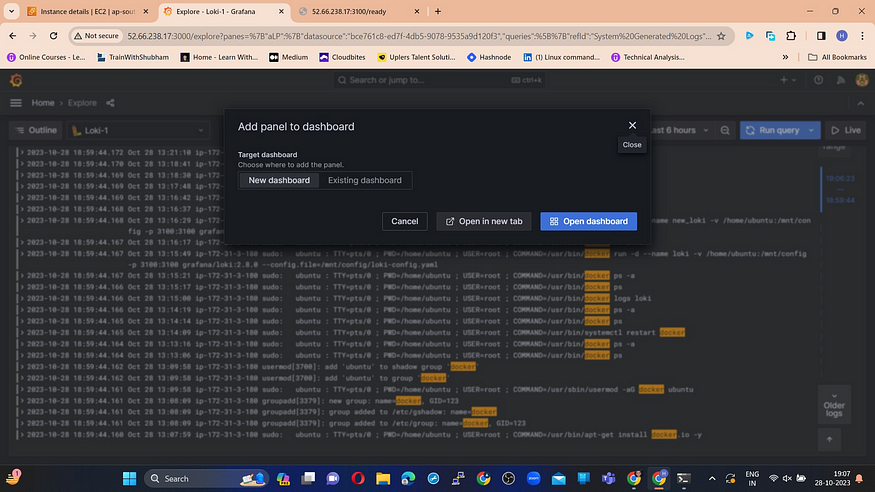
- We will create metrics that will show logs containing Docker in it.
  Name -> System Generated Logs
  Label Filters -> jobs, varlogs
  Line Contains -> docker
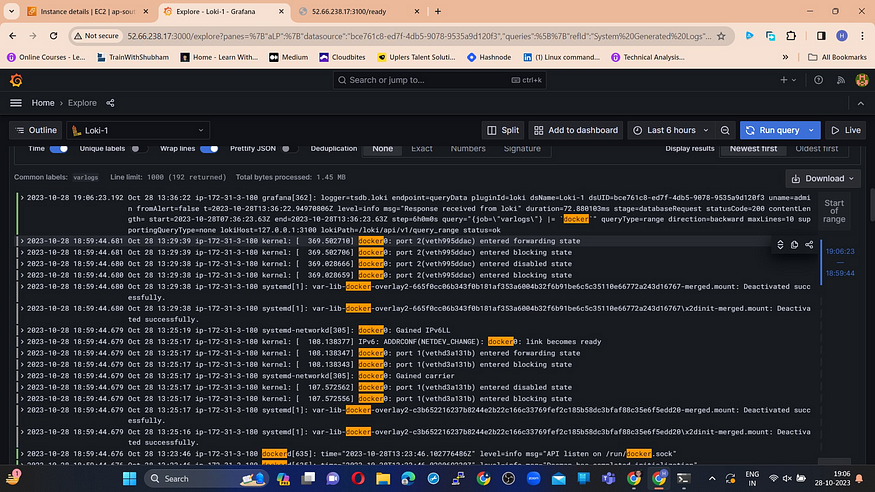
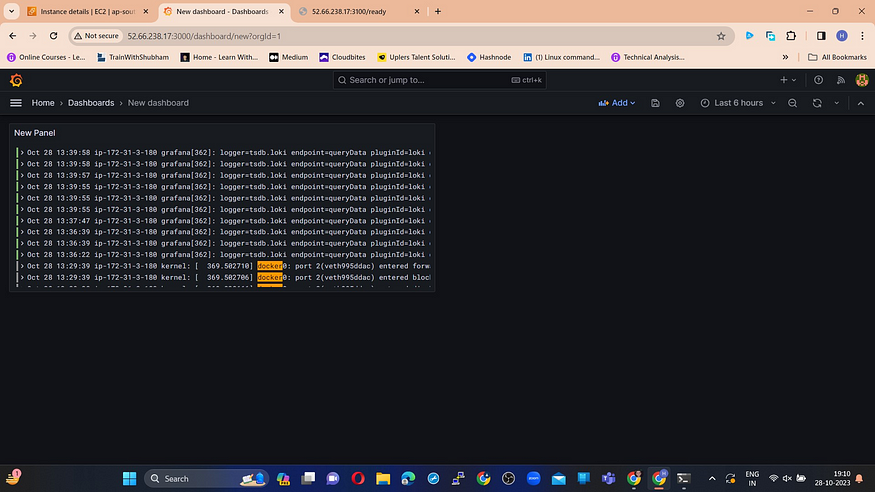
- Once you get the output we can put the result into a new dashboard, before that named it.